 Over 20 years of experience in Sterile, Biological Pharmaceutical and Hospital Facilities Engineering Design, Construction and Validation.


01 Jul Automating Climate Data Import into Excel from EPW Files
1. Introduction
In our previous article, How to import climatic data into Excel,we explained how to manually import climatic data into Excel from an EPW weather file and plot the outdoor air conditions on a psychrometric chart.
That workflow is perfectly valid when we want to understand the process step by step. However, once we start using this analysis regularly for different sites, the manual method becomes repetitive. Each new project requires the same sequence:
- open the EPW file
- skip the header rows
- extract dry bulb temperature, relative humidity and barometric pressure
- convert pressure units
- calculate humidity ratio
- plot the 8760 hourly weather points
- review the outdoor air conditions.
This is exactly the type of task that should be automated. In this article, we will describe how to automate the import of EPW climatic data into Excel using VBA, calculate the relevant psychrometric properties, and update an existing psychrometric chart automatically. The objective is not only to save time, but also to reduce manual errors and make the analysis repeatable for different project locations.
As an additional step, the imported EPW data will also be used to generate an annual psychrometric summary, quantifying how many hours per year fall into each outdoor air treatment zone, including heating, cooling, dehumidification, humidification, free cooling and desiccant candidate conditions.
2. What the automation does
The Excel automation developed for this workflow performs the following actions:
- It asks the user to select an EPW weather file.
- It imports the full EPW file into a raw data sheet.
- It creates a clean data sheet with only the relevant fields.
- It extracts the date, month, day and hour from the weather file.
- It extracts dry bulb temperature, relative humidity and atmospheric pressure.
- It converts pressure from Pa to kPa.
- It converts relative humidity from percentage to fraction.
- It calculates humidity ratio using an existing psychrometric function.
- It calculates moist air enthalpy using an existing enthalpy function.
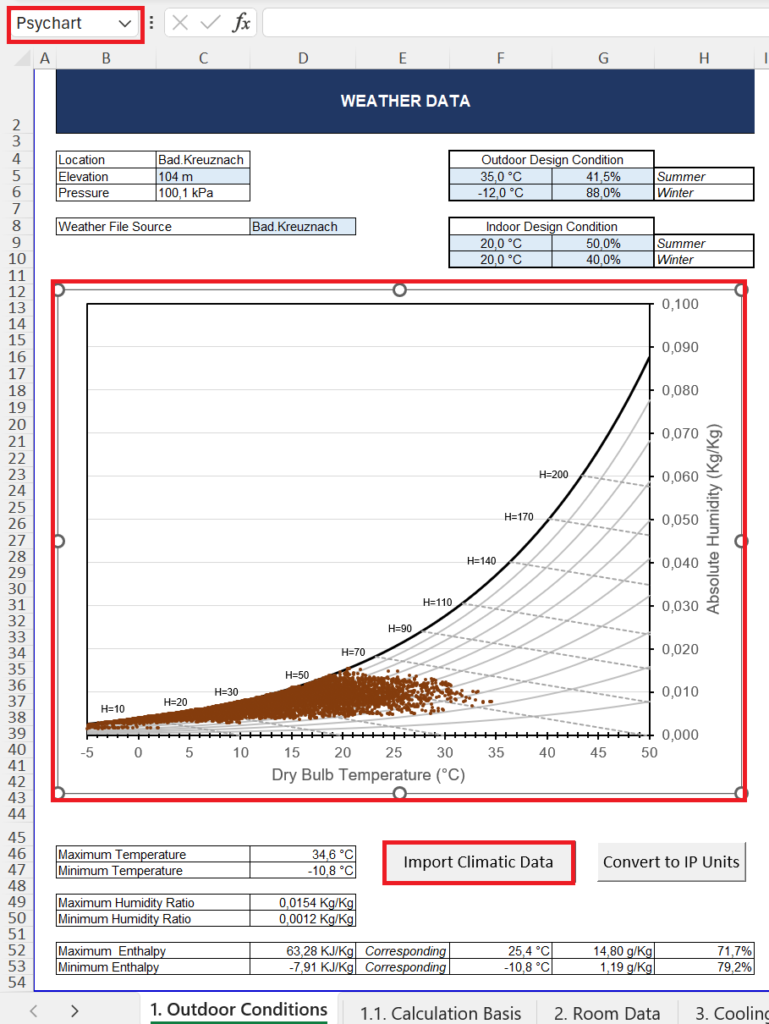
- It plots all outdoor air points on an existing psychrometric chart.
- It classifies every hour into a psychrometric treatment zone.
- It creates a summary table with the number of hours per year in each zone.
As explained in the original article, you can download the weather files from here
2. Psychrometric calculations
The macro assumes that the Excel workbook already contains two psychrometric functions: humidity ratio (function of dry bulb temperature, relative humidity and pressure) and enthalpy (function of dry bulb temperature and humidity ratio). You can create your own functions, or simply download them from many sites, as per example https://github.com/psychrometrics/psychrolib
Once the humidity ratio has been calculated, the automation updates the existing psychrometric chart.
The chart uses:
- dry bulb temperature as the X value;
- humidity ratio as the Y value.
A new series named Weather EPW is created or updated.
This allows the user to replace the climate file and immediately refresh the plotted weather cloud.
The plotted points give a very clear visual understanding of the outdoor air conditions for the selected location.
For example:
- a mild oceanic climate will show a compact cloud of points;
- a hot and humid climate will show high humidity ratio values;
- a hot and dry climate will show high dry bulb temperatures but lower humidity ratios;
- a cold climate will show many points in the heating and humidification region.
This visual information is extremely useful during early HVAC concept design.
3. Adding enthalpy to the analysis
In the manual version of the workflow, the main objective was to plot the weather points on the psychrometric chart.
The automated version goes one step further by calculating enthalpy for every hourly condition.
This is useful because enthalpy combines the sensible and latent energy content of the air.
For HVAC design, this helps to identify:
- high total cooling load periods;
- high latent load periods;
- potential energy recovery benefit;
- critical summer outdoor air conditions;
- hours where dehumidification becomes dominant.
In pharmaceutical HVAC systems, where outdoor air may be required for pressurisation, dilution or cleanroom classification strategies, the total energy content of the outdoor air can be very relevant.
3. Classifying outdoor air by psychrometric zone
The automation also classifies each hourly point into a psychrometric zone.
The current classification includes:
- Free cooling possible. Outdoor air may be directly useful or close to useful conditions
- Heating required. Outdoor air is below the lower temperature limit
- Cooling required. Outdoor air is above the upper temperature limit
- Dehumidification required. Outdoor air has excessive humidity ratio
- Humidification required. Outdoor air is too dry
- Desiccant candidate. Outdoor air has very high latent load or high enthalpy
This classification is intentionally simple. It is not intended to replace a detailed HVAC design calculation, but it is very useful as a first screening tool.
The limits can be adjusted inside the VBA code depending on the project criteria.
For example, the current settings are based on:
Lower temperature limit: 18 °C
Upper temperature limit: 24 °C
Lower humidity ratio limit: 0.0045 kg/kg
Upper humidity ratio limit: 0.010 kg/kg
Desiccant humidity ratio threshold: 0.014 kg/kg
Desiccant enthalpy threshold: 65 kJ/kg dry air
These values should be adapted to each project.
For a pharmaceutical facility, the relevant limits may depend on:
- cleanroom classification;
- target room temperature;
- target room relative humidity;
- process requirements;
- product sensitivity;
- GMP constraints;
- outdoor air percentage;
- energy recovery strategy;
- AHU configuration.
4. Creating an annual summary
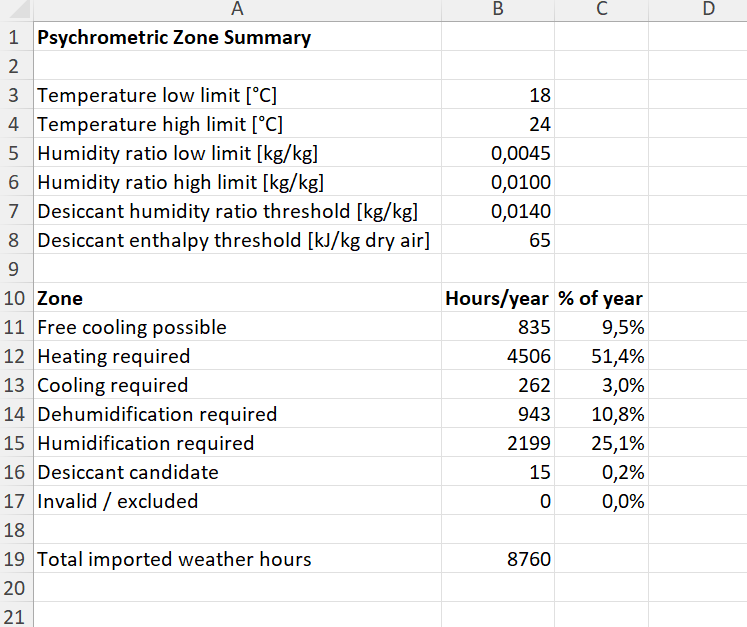
After classifying the hourly weather points, the macro creates a summary sheet called: EPW_zone_summary
This sheet counts how many hours per year fall into each psychrometric zone.
The output is similar to this:
This is where the analysis becomes more valuable.
Instead of only seeing a cloud of points, we now have a quantified view of how often each type of air treatment is expected.
For example, if a site has many hours in the Dehumidification required or Desiccant candidate regions, the design team should pay special attention to latent load, coil leaving conditions and possible dehumidification strategy.
If many hours are in the Humidification required region, then winter humidification demand may be a relevant energy and utilities topic.
5. Important limitations
This automation is a screening and design-support tool.
It should not be used as the only basis for final HVAC equipment sizing.
The designer should still consider:
- project design conditions;
- local codes and standards;
- ASHRAE climatic design data;
- extreme weather conditions;
- internal heat gains;
- process loads;
- room pressure cascade;
- cleanroom classification;
- air change rate strategy;
- exhaust requirements;
- redundancy philosophy;
- GMP and product requirements.
EPW files are very useful for annual climatic analysis, but equipment sizing may require specific design conditions rather than typical hourly weather data.
For critical pharmaceutical systems, this distinction is very important.
6. Conclusion
The original manual workflow showed how to import EPW climatic data into Excel and plot the outdoor air points on a psychrometric chart.
The automated version transforms that process into a reusable HVAC design tool.
With a single button, Excel can now:
- import the EPW file;
- clean the weather data;
- calculate humidity ratio;
- calculate enthalpy;
- update the psychrometric chart;
- classify each hourly condition;
- create an annual treatment summary.
This type of automation is especially useful in pharmaceutical HVAC design, where outdoor air treatment has a direct impact on energy consumption, cleanroom control, humidification, dehumidification and AHU configuration.
It is not about replacing engineering judgement. It is about giving the engineer a faster and clearer way to understand the climate before making HVAC design decisions.
7. Download the VBA automation code
You can download the VBA module used for this automation here:
Download EPW Climate Automation VBA Code
The code is provided as a VBA module and should be reviewed and adapted before being used in a project workbook.
Before running the macro, make sure that:
- your workbook is saved as
.xlsm; - macros are enabled;
- your psychrometric chart sheet name matches the VBA settings;
- your chart object name matches the VBA settings;
- the workbook includes the required psychrometric functions;
- the humidity ratio units match the chart axis.
The tool can then be adapted to suit each project’s indoor design criteria, cleanroom requirements and HVAC strategy.
Image by -Rita-👩🍳 und 📷 mit ❤ from Pixabay




No Comments